VCF Automation
Introducing the VCF Automation Assessment Tool
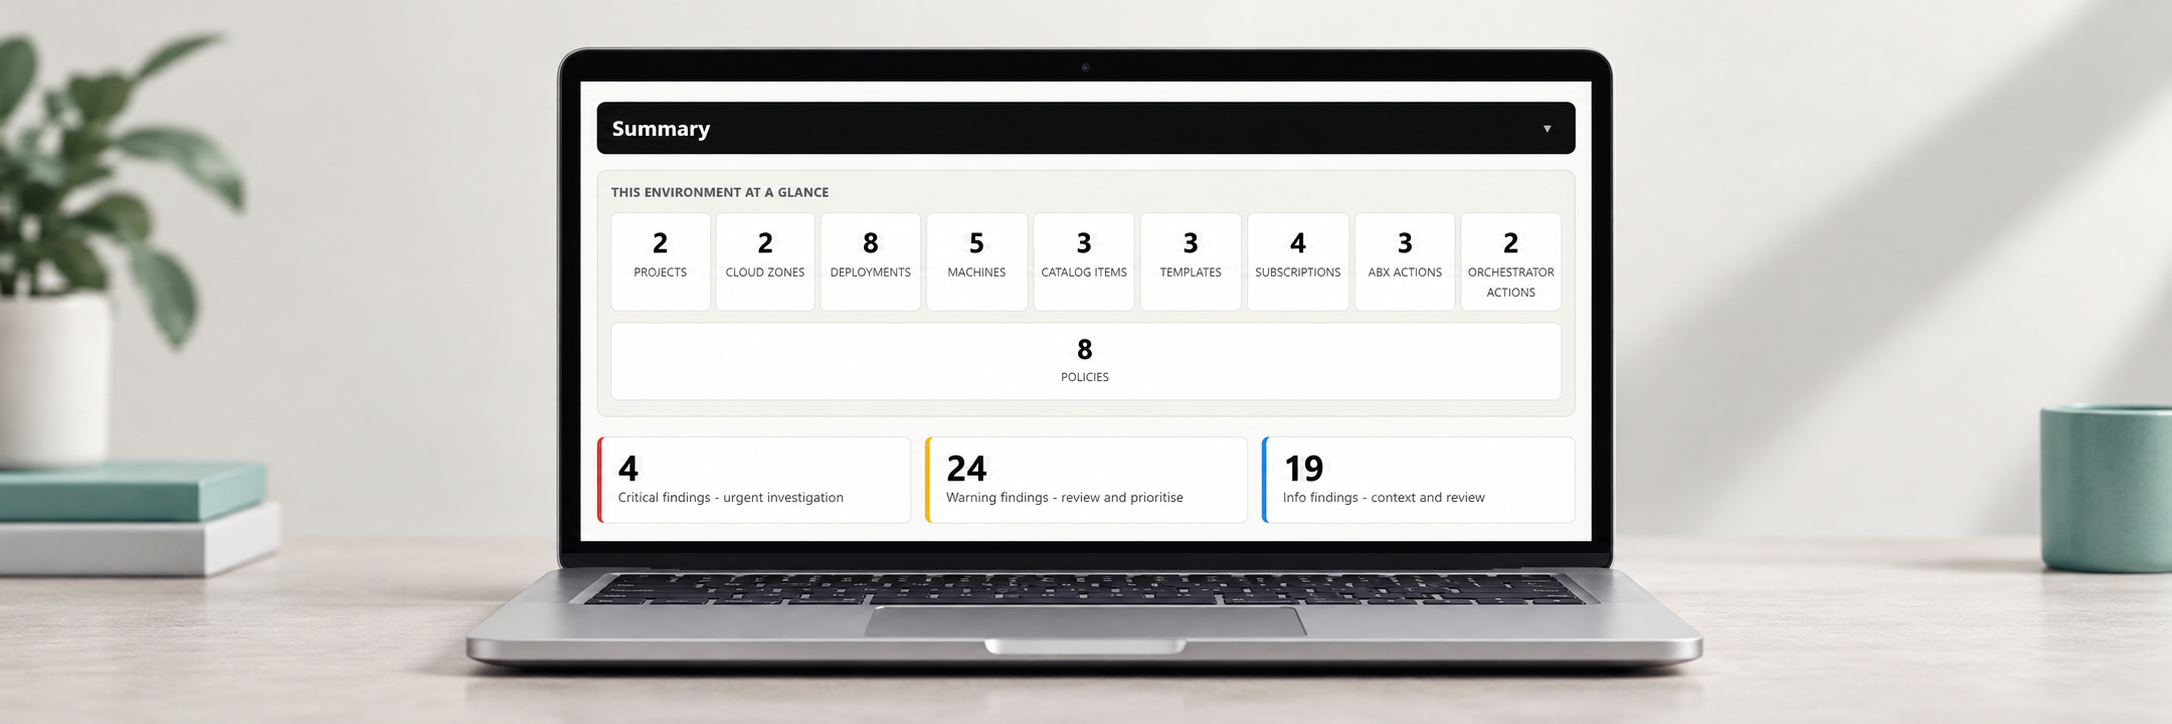
Understanding an established VCF Automation environment takes more than counting projects and deployments. You need to know how its configuration fits together, who can request its services, and which parts need attention.
I created the VCF Automation Assessment Tool to bring that information into one report. It reads the platform’s REST APIs and produces a self-contained HTML report covering configuration, usage, governance and extensibility.
This article introduces the tool and walks through a first assessment of a VCF Automation 8.x environment.
The tool currently targets VCF Automation 8.x. Compatibility with VCF Automation 9 VM Apps organisations has not been verified. All Apps organisations are not supported.
The source and full documentation are available in the VCF Automation Assessment Tool repository.
What the assessment gives you
The tool combines an inventory with findings that identify potential problems and configuration worth reviewing. It is read-only against the platform: it does not repair configuration, delete deployments or execute the automation it analyses.
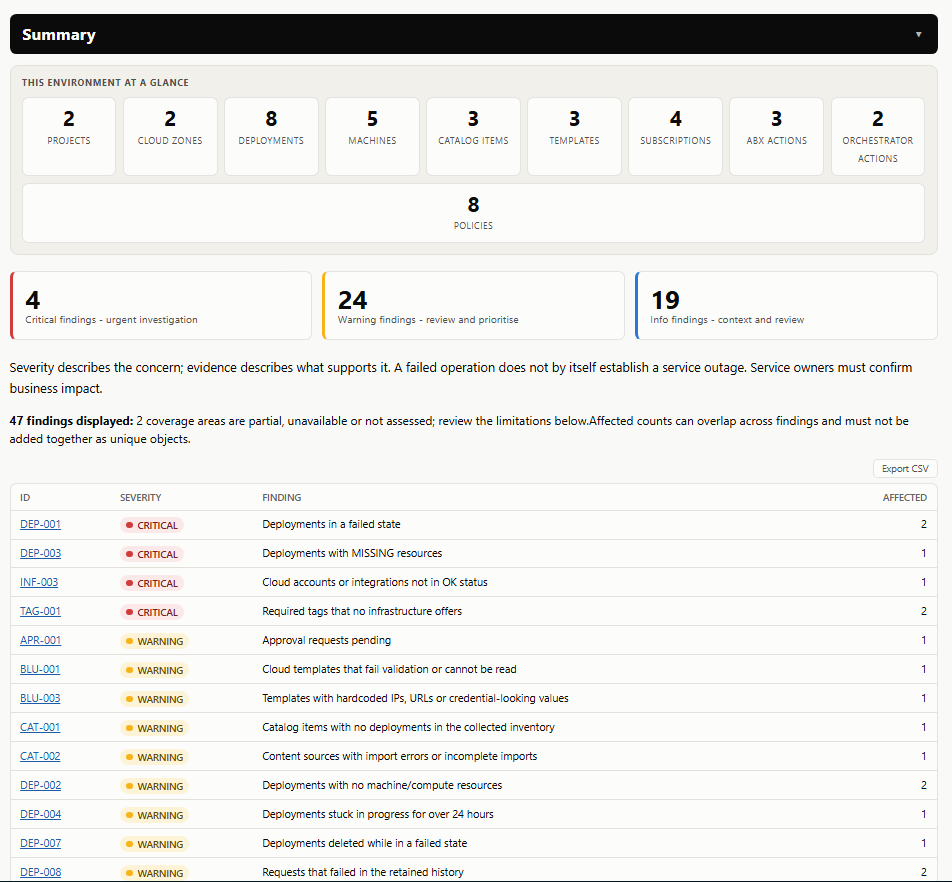
The report starts with Summary, showing inventory counts, severity totals and a findings table. Assessment Coverage follows, then separate sections let you work through each area in more detail.
| Report area | What you can inspect |
|---|---|
| Assessment Coverage | Collection status, limitations and the checks that depend on each area |
| Infrastructure | Accounts, zones, profiles, project quotas and allocation, and tags used by templates |
| Consumption | Catalogue usage, project access, deployment status, ownership and machines |
| Policies and Governance | Policies grouped by type, approval chains and approval requests |
| Design and Templates | Template validation, versions, placement diagrams and custom resources |
| Extensibility | Subscriptions, referenced Orchestrator workflows, and analysis of Orchestrator and ABX action source |
| Collection Gaps, when present | Findings about collection failures that need investigation |
For example, a deployment can fail while still holding machines. The report identifies that situation so you can investigate the resources that remain. Other checks highlight exhausted project quotas, invalid templates, disabled subscriptions and approval requests that have been waiting too long.
Findings use INFO, WARNING and CRITICAL severities. An informational finding can be a useful review list rather than a fault. The findings reference explains the individual checks and their conditions.
Each finding also shows an evidence label, suggested priority, why it matters, a recommended action and verification guidance. Evidence labels distinguish Observed failure, Potential issue and Review candidate. A failed operation does not by itself establish a current service outage; the environment’s owners still need to confirm the business impact.
The HTML report includes its scripts and diagrams, so opening it requires no external requests. You can inspect it offline and print the summary or full evidence.
Every inventory and finding table includes an Export CSV button, so you can export individual tables for review in a spreadsheet or share them with the relevant owners. Affected-object tables show up to 500 rows per finding by default. CSV exports retain that limit; the optional JSON output holds the full collected data and findings.
Set max_rows_per_finding in config.yaml to change the limit. For example, this allows up to 1,000 rows per finding:
max_rows_per_finding: 1000Inspect catalogue usage and deployments
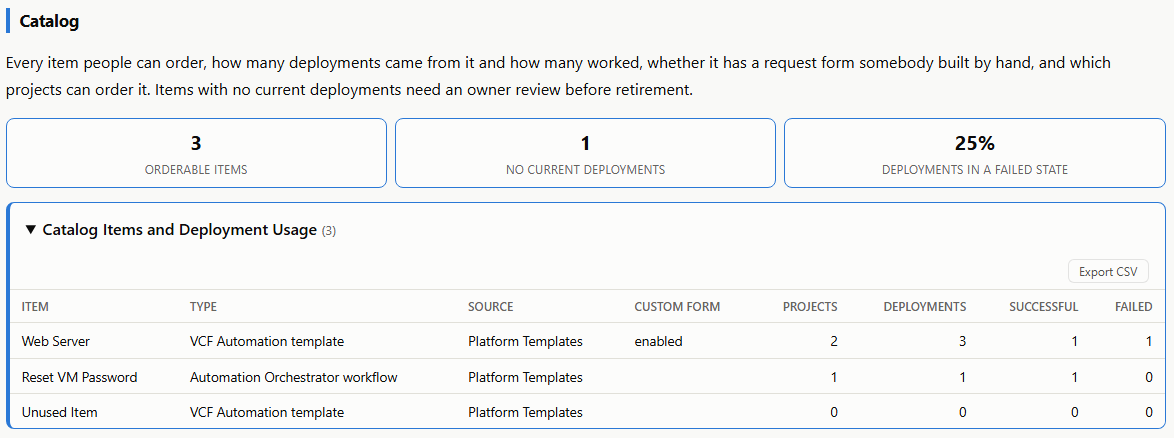
The catalogue inventory connects each item with its source, project access and deployment counts. This helps you identify items to review with their owners.
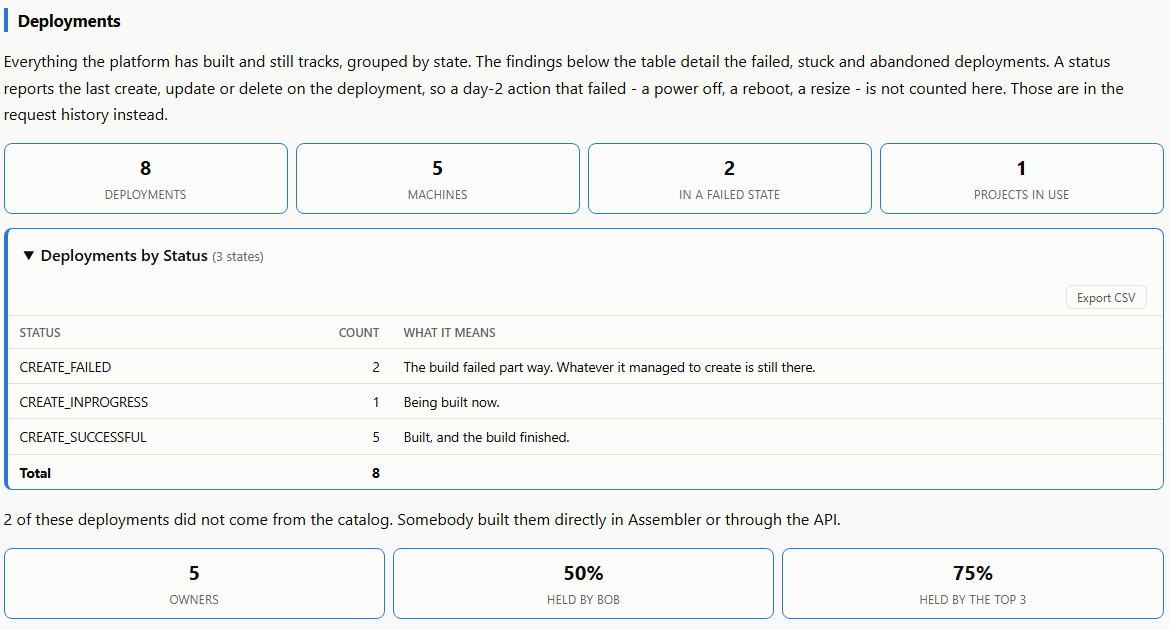
The deployment view groups deployments by their recorded status and summarises machines, projects and ownership.
Follow the relationships behind the inventory
An inventory tells you what exists. The relationships between those objects help explain how the environment works.
The catalogue access map shows which projects can consume each item. Flow diagrams separate provisioning, subsequent changes and disposal, making the associated automation easier to follow. Placement diagrams connect template requirements with the infrastructure available to requesting projects.
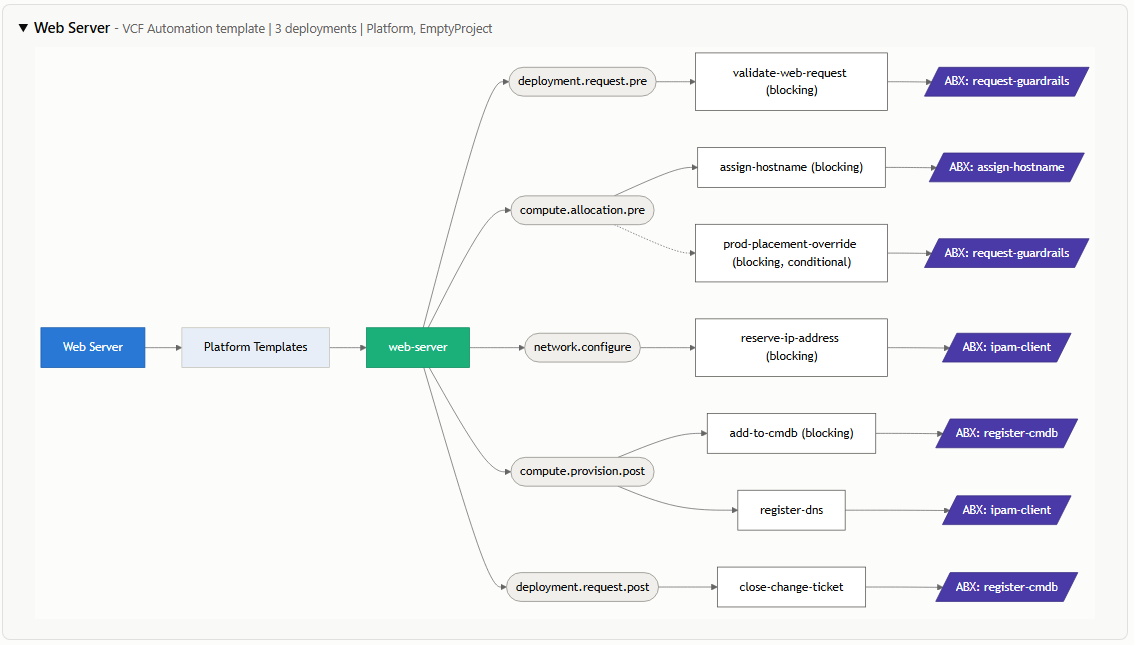
For extensibility, the tool resolves referenced Orchestrator workflows against embedded and external Orchestrators. It also analyses customer-authored Orchestrator actions and ABX action source for code-quality signals and complexity.
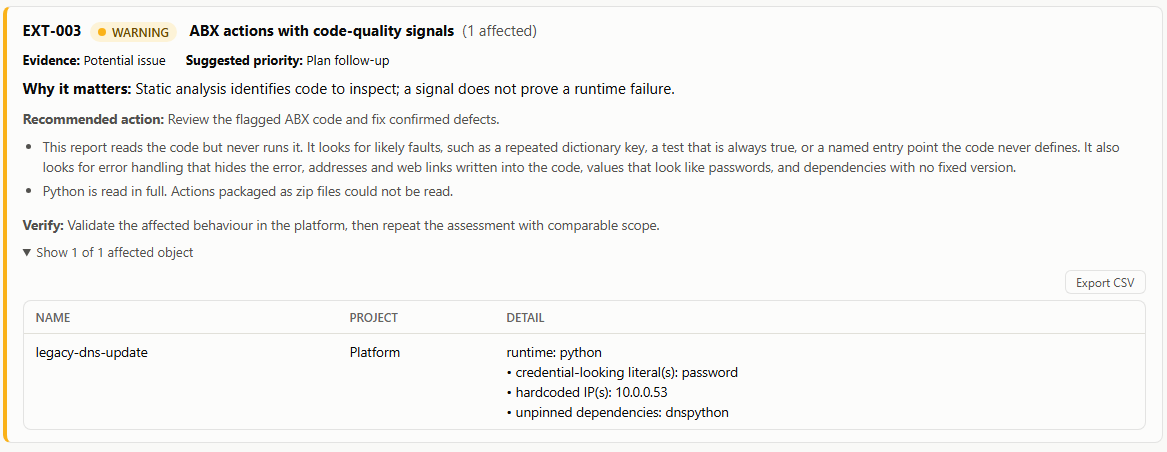
These results still need interpretation. A workflow that the account cannot see is not necessarily deleted. Likewise, an ABX action with no retained run records is not proof that it has never run. The report accounts for these evidence limits instead of treating every missing record as a confirmed problem.
Run your first assessment
The examples below use PowerShell on Windows. You need Git, Python 3.11 or later, and network access to the VCF Automation APIs.
The project documents Organization Owner plus the Assembler and Service Broker administrator roles for full organisation-wide coverage. With fewer permissions, collection can be incomplete; the report records those gaps under SYS-001.
Install the tool
Clone the repository and select the release used in this article:
git clone https://github.com/simplygeekuk/vmware-vcf-automation-assessment-tool.git
cd vmware-vcf-automation-assessment-tool
git checkout v1.0.0
Create a Python virtual environment and install the tool:
python -m venv .venv
.venv\Scripts\pip install -e .
Configure the connection
Copy the supplied configuration:
Copy-Item config.example.yaml config.yamlEdit config.yaml and set url and username for your environment. Add domain if your identity source requires it.
Use config.yaml for settings you want to reuse. Command-line options override the corresponding configuration values for an individual run.
The following values are examples:
url: https://vra.example.com
username: assessment-user
domain: example.com
For an appliance certificate issued by an internal certificate authority, set ca_bundle to the appropriate certificate bundle:
ca_bundle: C:\certificates\internal-ca.pemThe tool prompts for the password without echoing it. It does not read a password from the configuration file. For authentication with an existing refresh token, use the VCF_REFRESH_TOKEN environment variable instead.
Generate the report
Run the assessment from the repository directory:
.venv\Scripts\vcf-automation-assessment-tool --output reports\assessment.html --json reports\assessment.jsonThe tool reads config.yaml automatically and reports progress through collection, analysis and rendering. It creates the output directory if needed.
To reuse these output paths, add them to config.yaml:
output: reports/assessment.html
json: reports/assessment.json
Then run the tool without the output options:
.venv\Scripts\vcf-automation-assessment-toolThese fixed paths are reused on subsequent runs. Keep a separate copy of any JSON baseline you want to retain for comparison.
Open the HTML report:
Start-Process .\reports\assessment.htmlCheck assessment coverage before drawing conclusions
Start with Assessment Coverage, available through the Coverage navigation link. It lists each area’s collection status, limitations and dependent checks. A Collected status means no limitation was recorded for that area; it does not prove full administrative visibility or that every check passed.
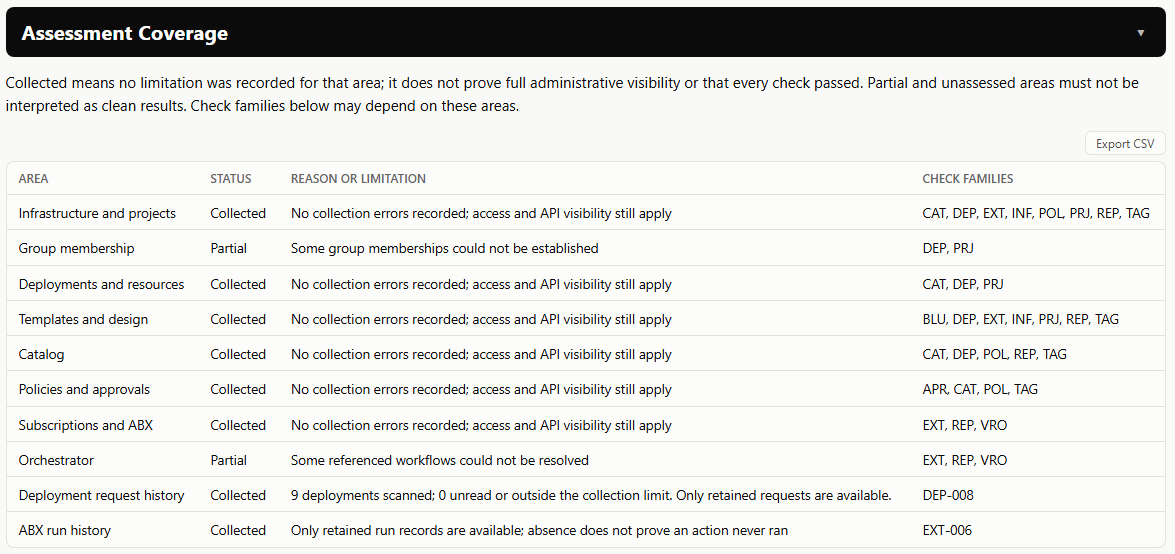
Review partial, unavailable and unassessed areas before interpreting a low finding count. Collection and analysis errors appear in the coverage details when recorded. A separate Collection Gaps section appears when it has findings to display and has not been hidden.
For each finding, inspect the affected objects and the supporting evidence. Confirm the intended configuration with the environment’s owners before making changes. The report supplies an investigation list; the tool does not apply the changes for you.
The report provides search across displayed findings and inventory, plus finding filters for severity, evidence and project. These filters do not filter the inventory, and summary totals remain those of the full displayed assessment. Search cannot find rows omitted by the report’s row limit.
Optional replatforming assessment
The supplied configuration hides Replatforming. Removing replatforming from ignore_sections in config.yaml includes that section. It maps capabilities to Terraform, GitLab CI/CD, Ansible Automation Platform and OpenShift, with ServiceNow or a similar portal for requests and approvals.
Per-item ratings describe content conversion complexity, not effort estimates. The report also identifies Orchestrator dependencies, but does not assess workflow internals or packaged ABX code. Live deployments need a separate import, rebuild or retirement plan. The tool does not perform a migration or establish that an existing implementation can move unchanged.
Hide findings from the report
To omit a finding from the generated HTML, add its check ID to ignore_findings in config.yaml. The supplied configuration already hides DEP-002, which flags deployments with no machine resources:
ignore_findings:
  - DEP-002
Add further IDs as separate list entries, or remove an ID to show that finding again. To hide a finding for one run, use the command-line option instead:
.venv\Scripts\vcf-automation-assessment-tool --ignore-finding DEP-002Repeat --ignore-finding for each ID you want to hide. Command-line entries replace the configuration file’s list for that run, so include every ID you want to suppress.
Hiding report sections or findings changes the HTML presentation, not collection or analysis. The checks still run, suppressed findings remain in the JSON output when requested, and the HTML header identifies what was hidden.
Suppression also affects the final command-line counts and the exit code for critical findings, which use the visible findings. For automated runs, keep that behaviour in mind when choosing what to hide.
Compare assessments over time
Keeping the JSON output gives you a baseline for a later assessment. After reviewing and addressing findings, run the tool again with the earlier file:
.venv\Scripts\vcf-automation-assessment-tool --compare reports\assessment.json --output reports\follow-up.html --json reports\follow-up.jsonAlternatively, set the baseline and new output paths in config.yaml, then run the tool without these command-line options:
compare: reports/assessment.json
output: reports/follow-up.html
json: reports/follow-up.json
Replace the existing output and json settings rather than adding duplicate keys. Keep the baseline path different from the new JSON output path.
The summary then shows findings that appeared or were resolved, changes to affected-object lists, and inventory counts from both runs.
Use comparable scope, permissions and assessment settings for both runs, and check Assessment Coverage in each report. The comparison marks findings Unable to reassess when missing evidence or changed settings prevent a reliable classification. Unknown or changed check definitions also require a new baseline.
Resolved means the finding is no longer flagged in comparable evidence, rather than confirmed remediation. Objects can disappear through deletion or history retention, so verify the change before treating it as a completed fix.
Share a redacted copy
Reports can contain identities, host names, addresses and configuration details. The --redact option produces a second HTML report from the same collection:
.venv\Scripts\vcf-automation-assessment-tool --output reports\internal.html --redactBy default, redaction replaces identities, hosts and tags with aliases that stay consistent within the report. Object names and internal identifiers are optional classes. To enable redaction through config.yaml, add redact: true. The following example also replaces names that might reveal a business unit or application:
redact: true
redact_classes:
  - identity
  - hosts
  - tags
  - names
  - ids
Redaction happens after analysis, preserving the findings and counts. The tool checks the rendered report for known identifying values and refuses to write the redacted copy if a checked value remains.
Review the resulting file before sharing it. Values the tool did not recognise can remain, including details in free-text descriptions. The JSON output is never redacted, and any alias mapping produced with redact_key must remain internal.
If the first run is incomplete
| Symptom | What to check |
|---|---|
| Authentication fails | Verify the appliance URL, account details and identity source domain. Review the server error reported by the tool. |
| Certificate verification fails | Configure ca_bundle with the certificate authority that issued the appliance certificate. Alternatively, disable certificate verification with --insecure or insecure: true in config.yaml. |
| Expected inventory is missing | Read Assessment Coverage and its error details, then verify the account’s roles and access. |
| Collection times out | Review connectivity and appliance load, then adjust timeout (seconds per request) and retries in config.yaml if needed. |
| PowerShell source analysis uses heuristics | Make pwsh or powershell available on the assessment host’s PATH for native parsing. |
Try it against your environment
The repository includes a sample HTML report built from synthetic test data. Download the file and open it locally to explore the report before connecting to an appliance.
The sample includes Replatforming and findings that the supplied configuration hides. Your first report can therefore show fewer sections and findings even when collection succeeds.
For the maintained configuration guidance and check descriptions, see the project README.
Start with one assessment, establish what the tool could collect, and use the findings to prioritise your review. Keep the JSON baseline so that the next run can show what changed. That turns a point-in-time inventory into a useful record of the environment and the work still to do.
Related articles

How I Write Beautiful Code in VCF Operations Orchestrator using ESLint and Prettier
Configure ESLint and Prettier for Orchestrator JavaScript development, including command-line checks, VS Code formatting and performance tuning.

VCF Operations Orchestrator: Auto-Document Your Actions with Ease
Generate Markdown documentation from Orchestrator actions, class wrappers and JSDoc comments in a Build Tools JavaScript project.

VCF Operations Orchestrator: Why I Write Actions and Not Workflows (Mostly)
Why I move Orchestrator logic into reusable JavaScript actions, keep workflows small and use development tools for testing and code review.
Join the discussion
Sign in with GitHub to leave a comment. View discussions on GitHub.